UX Design · Banking · Content Design · Mobile
Card Comparison Redesign
Redesigning a credit union’s card comparison page so people can choose the right credit card with confidence, through clear guidance, costs shown in dollars, and a mobile layout built for comparing.
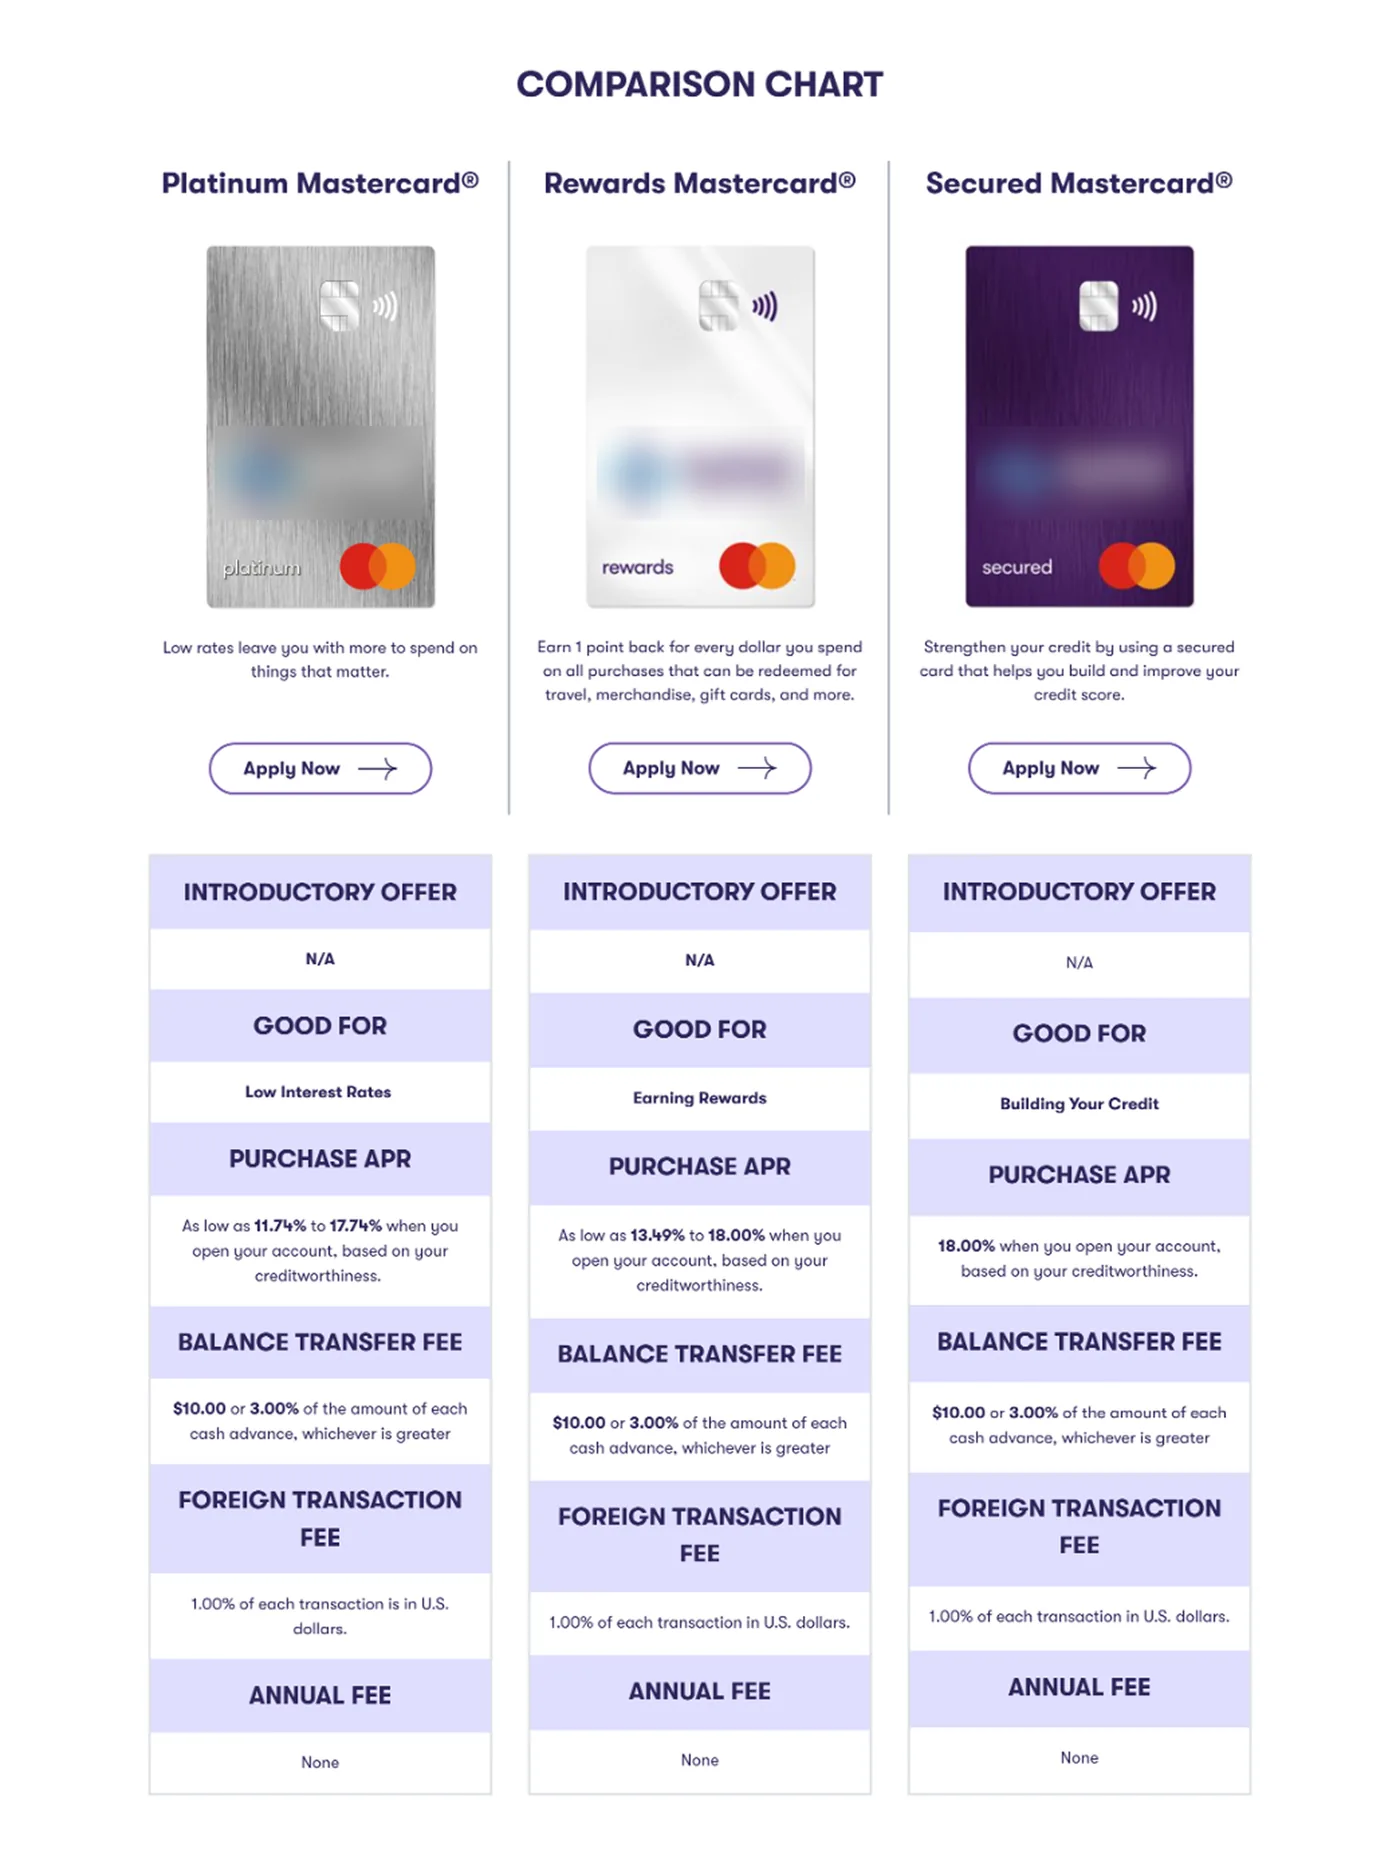
Before
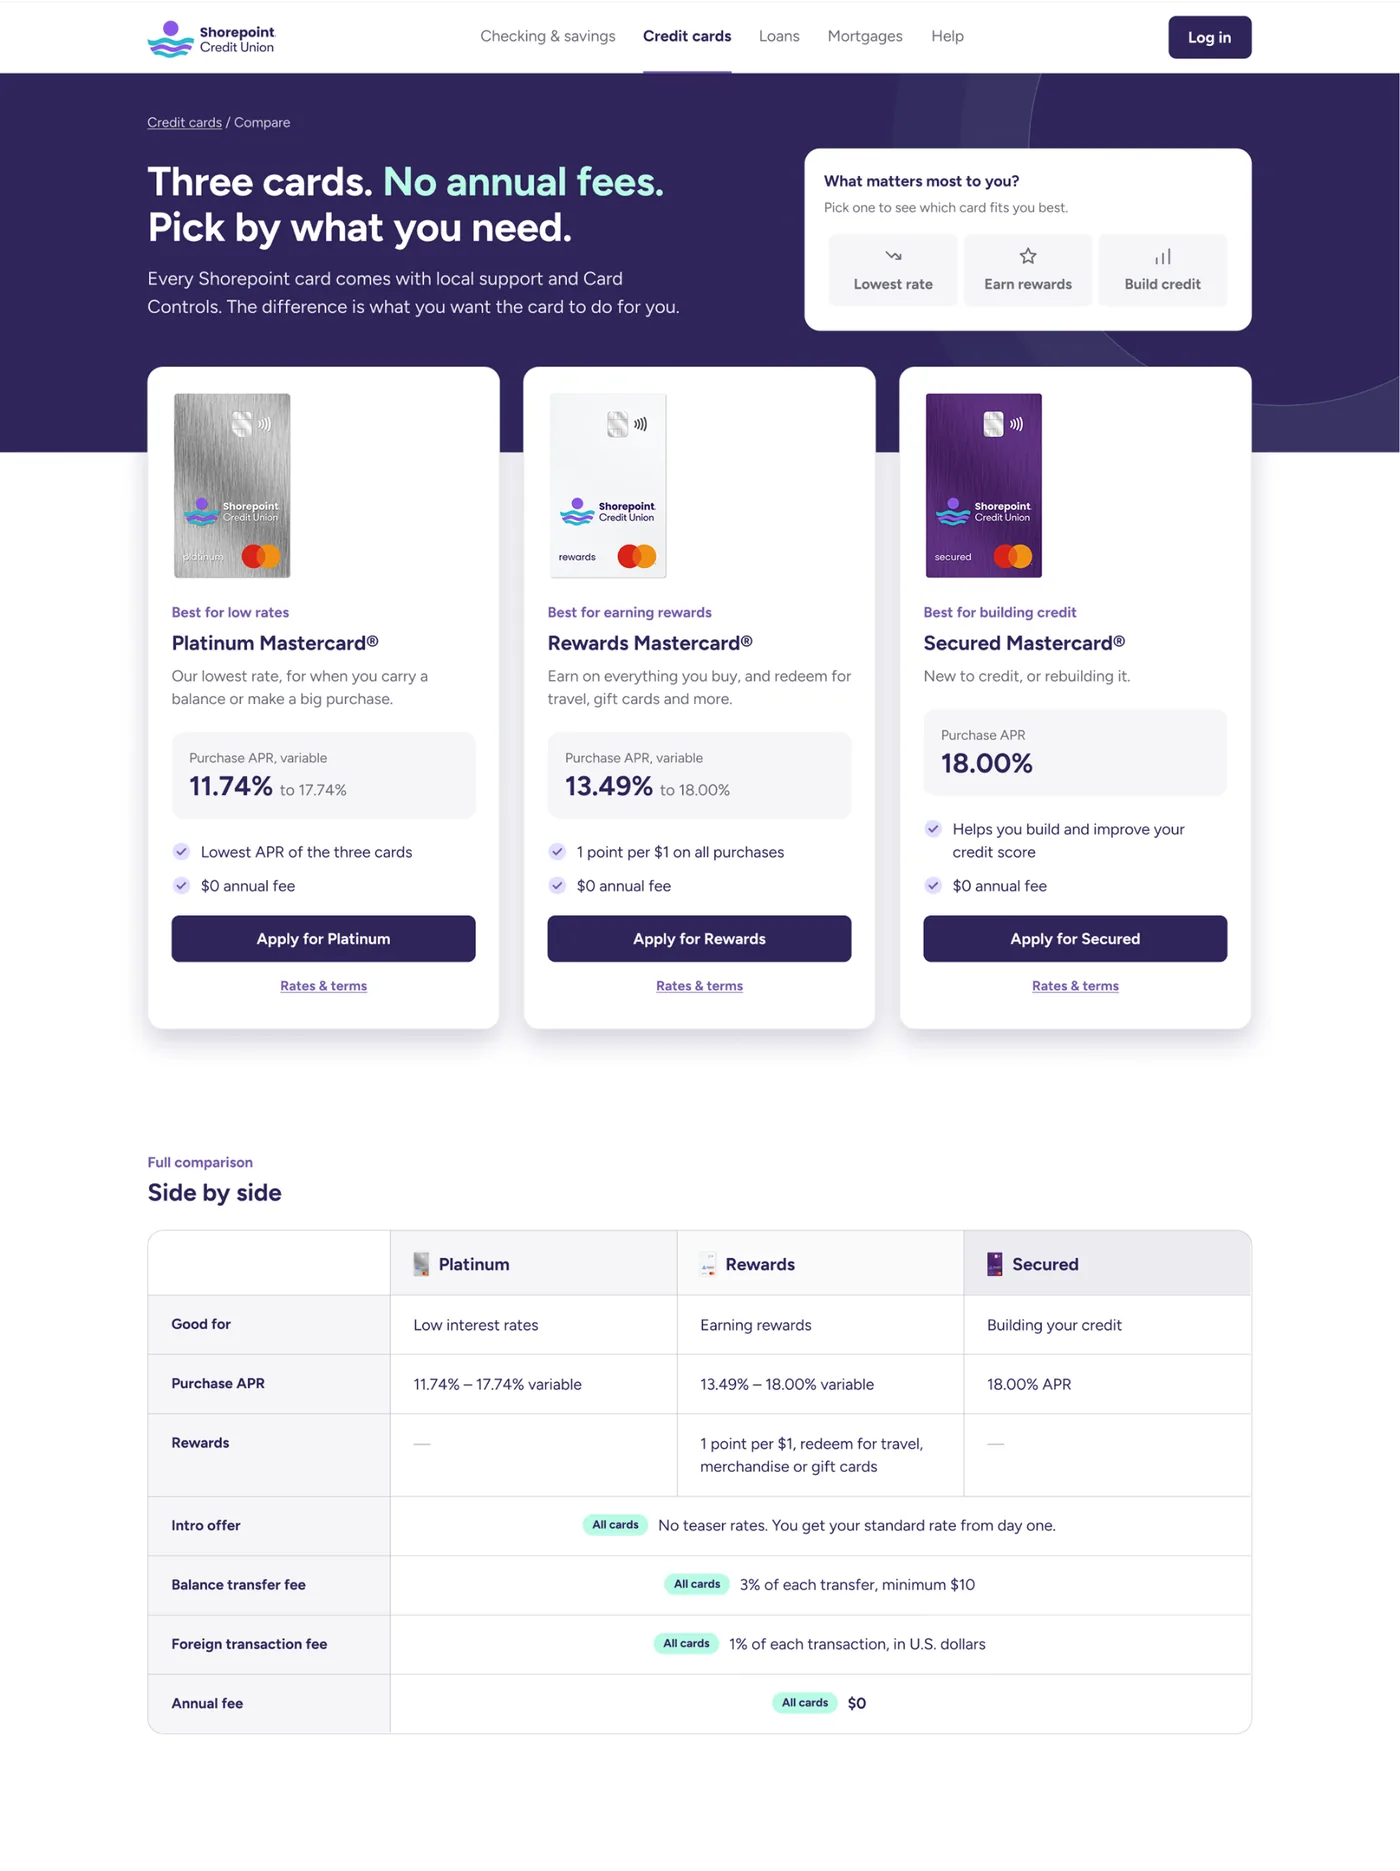
After
01
The problem
Three cards, no help choosing.
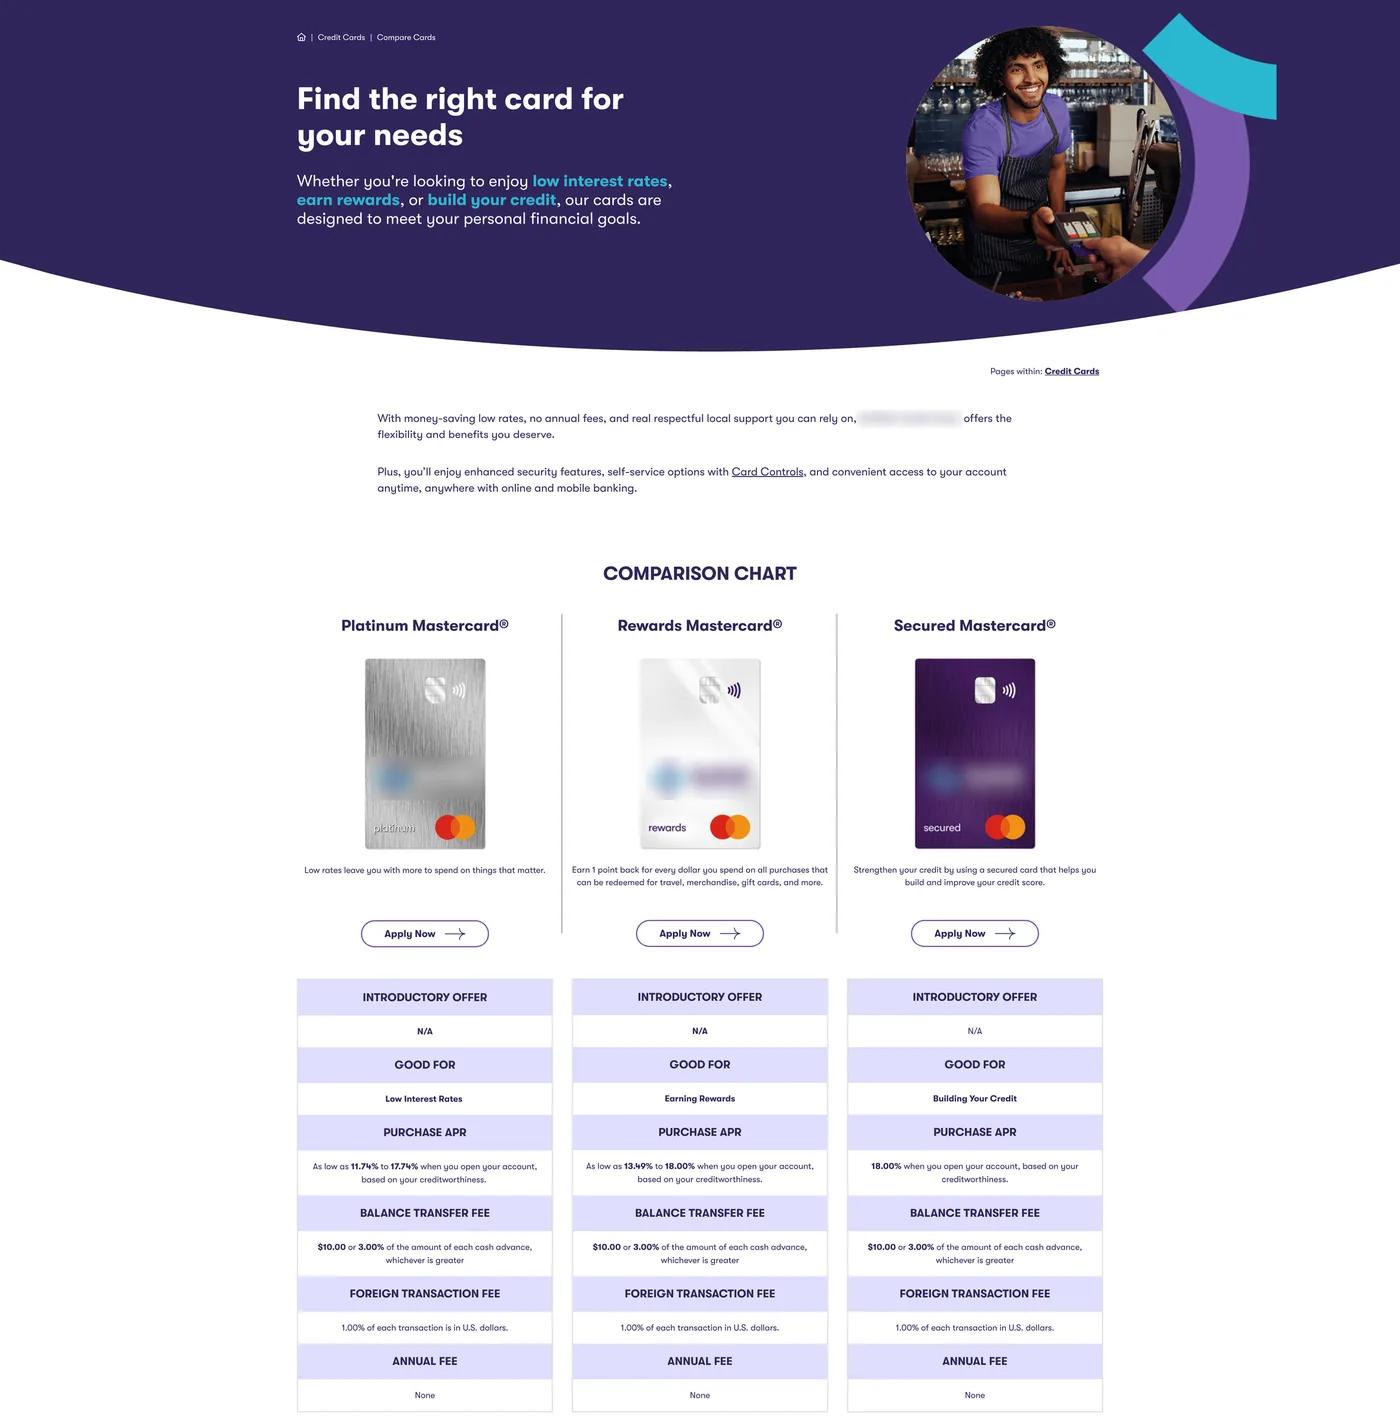
The page never explained the real decision, a lower rate or rewards. On a phone it showed one card at a time, and the FAQ said there was no fee abroad while the table listed 1%.
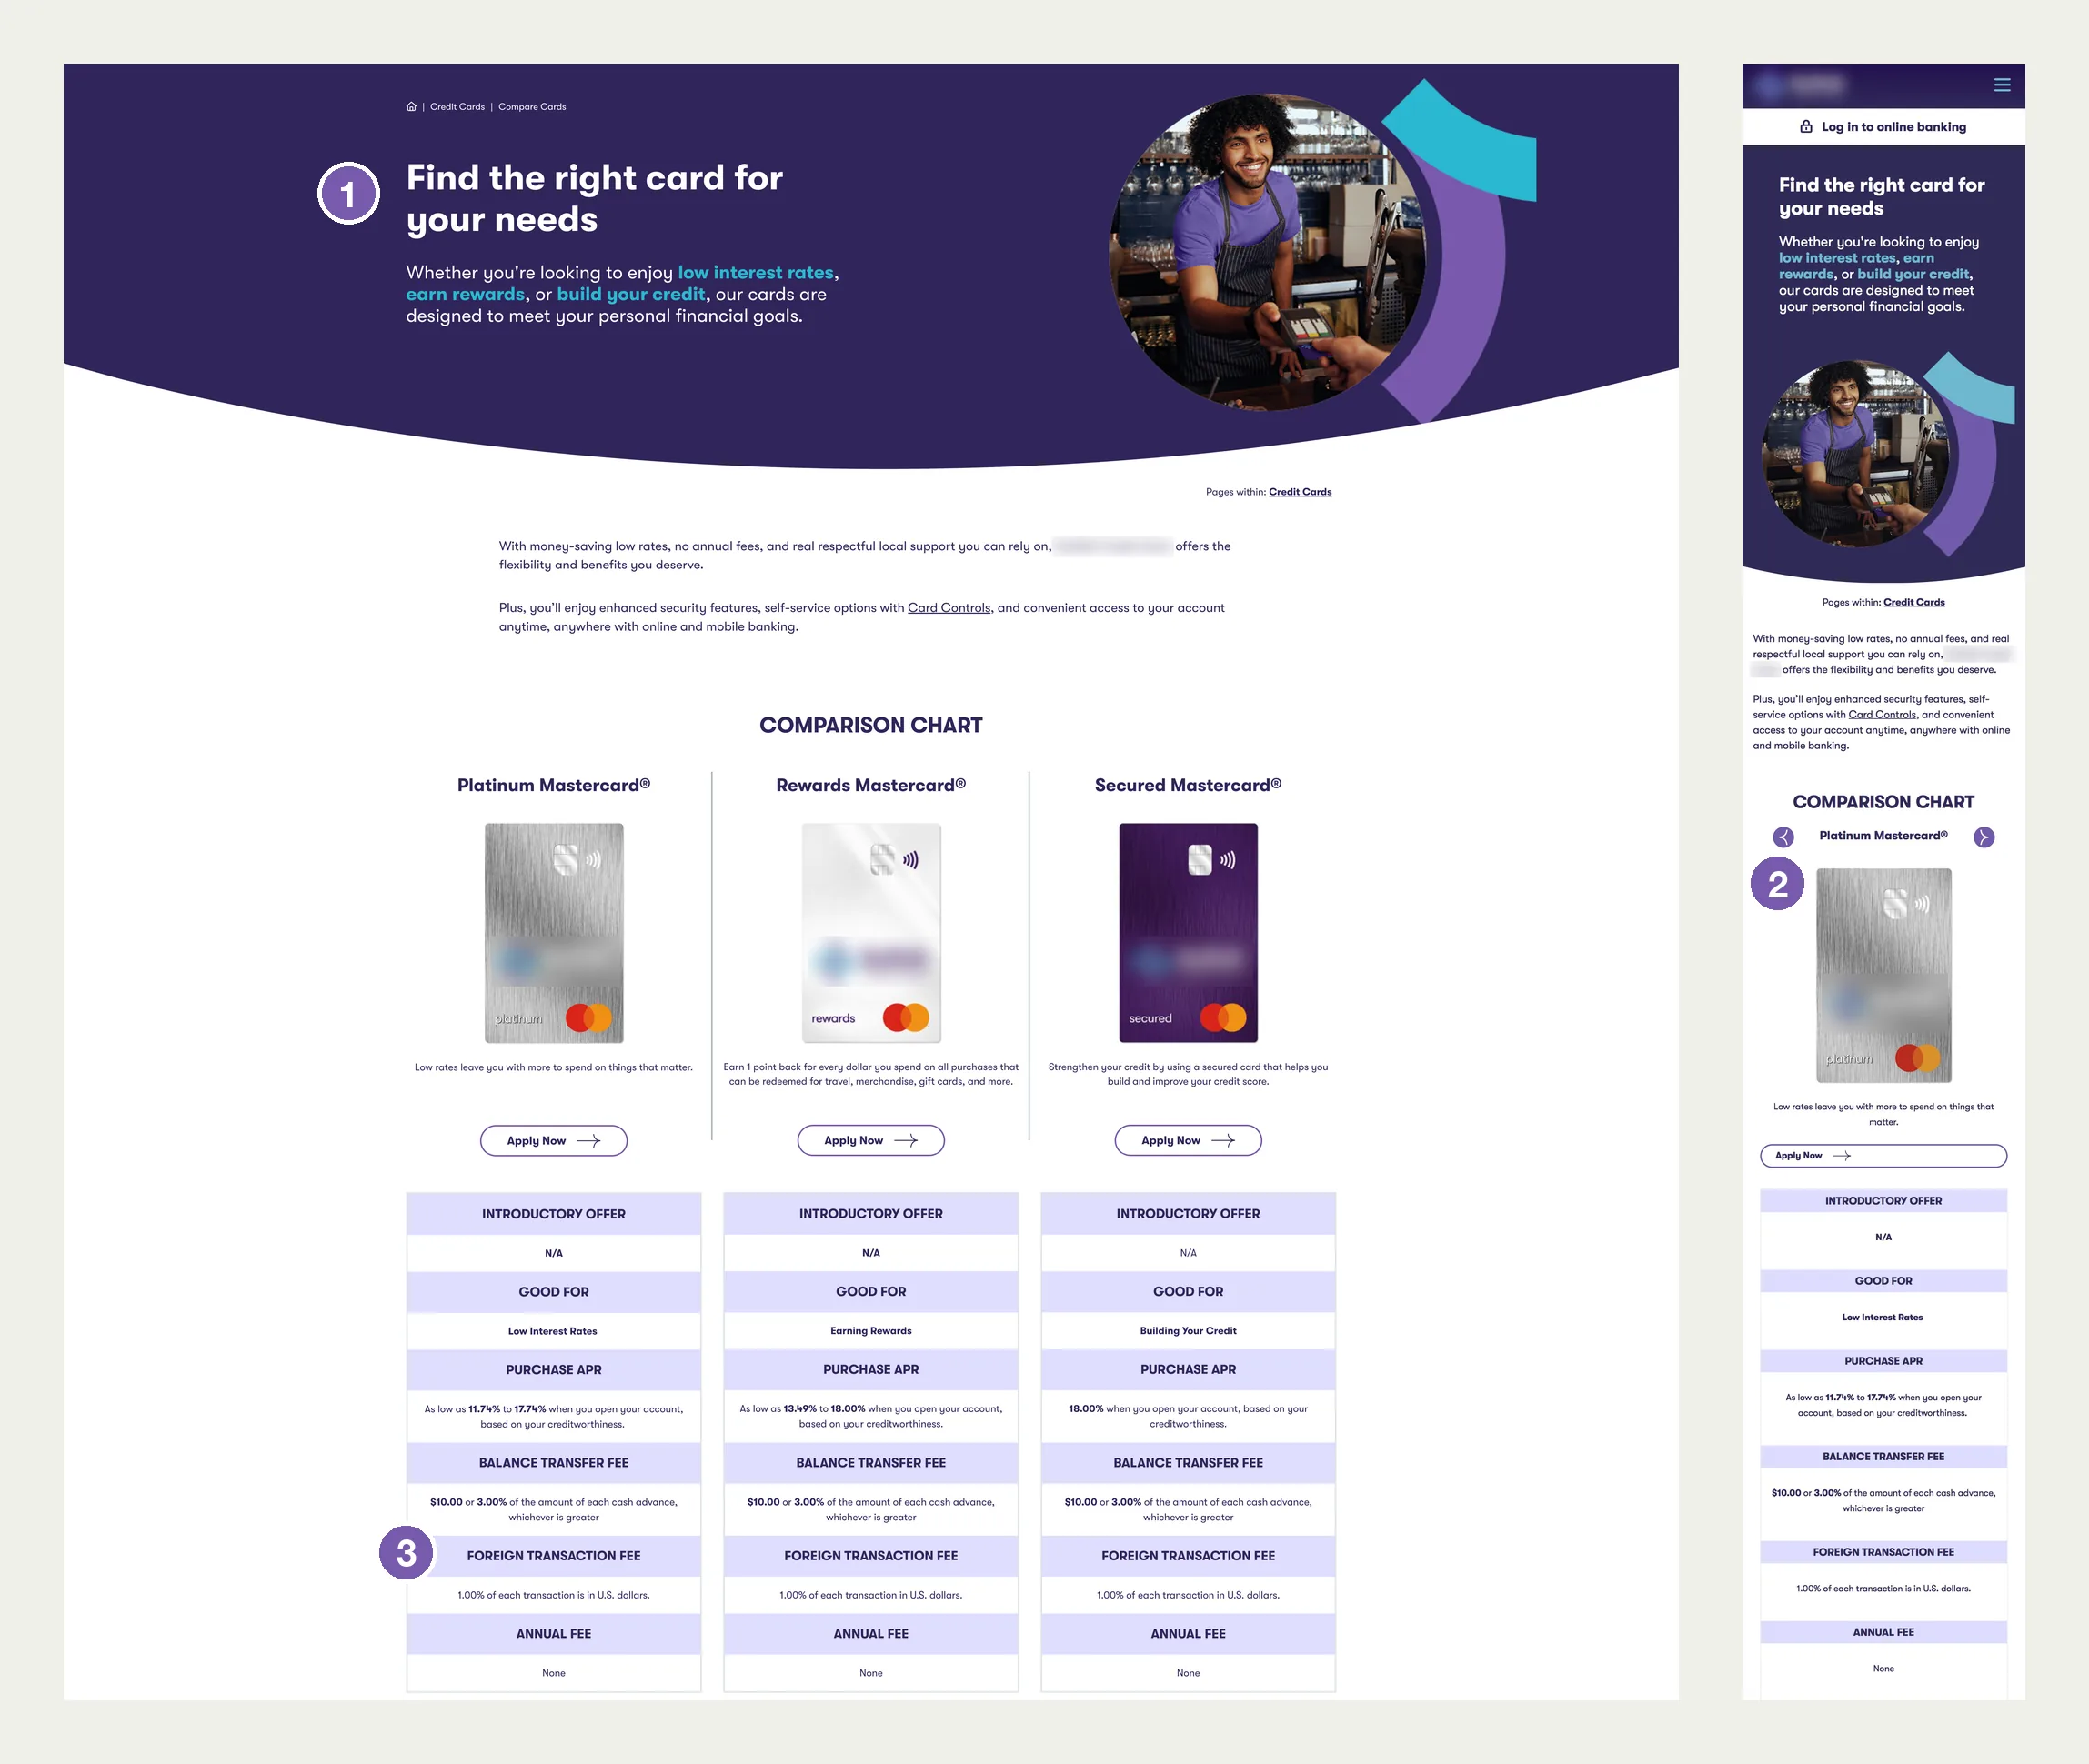
1Promises guidance, offers none
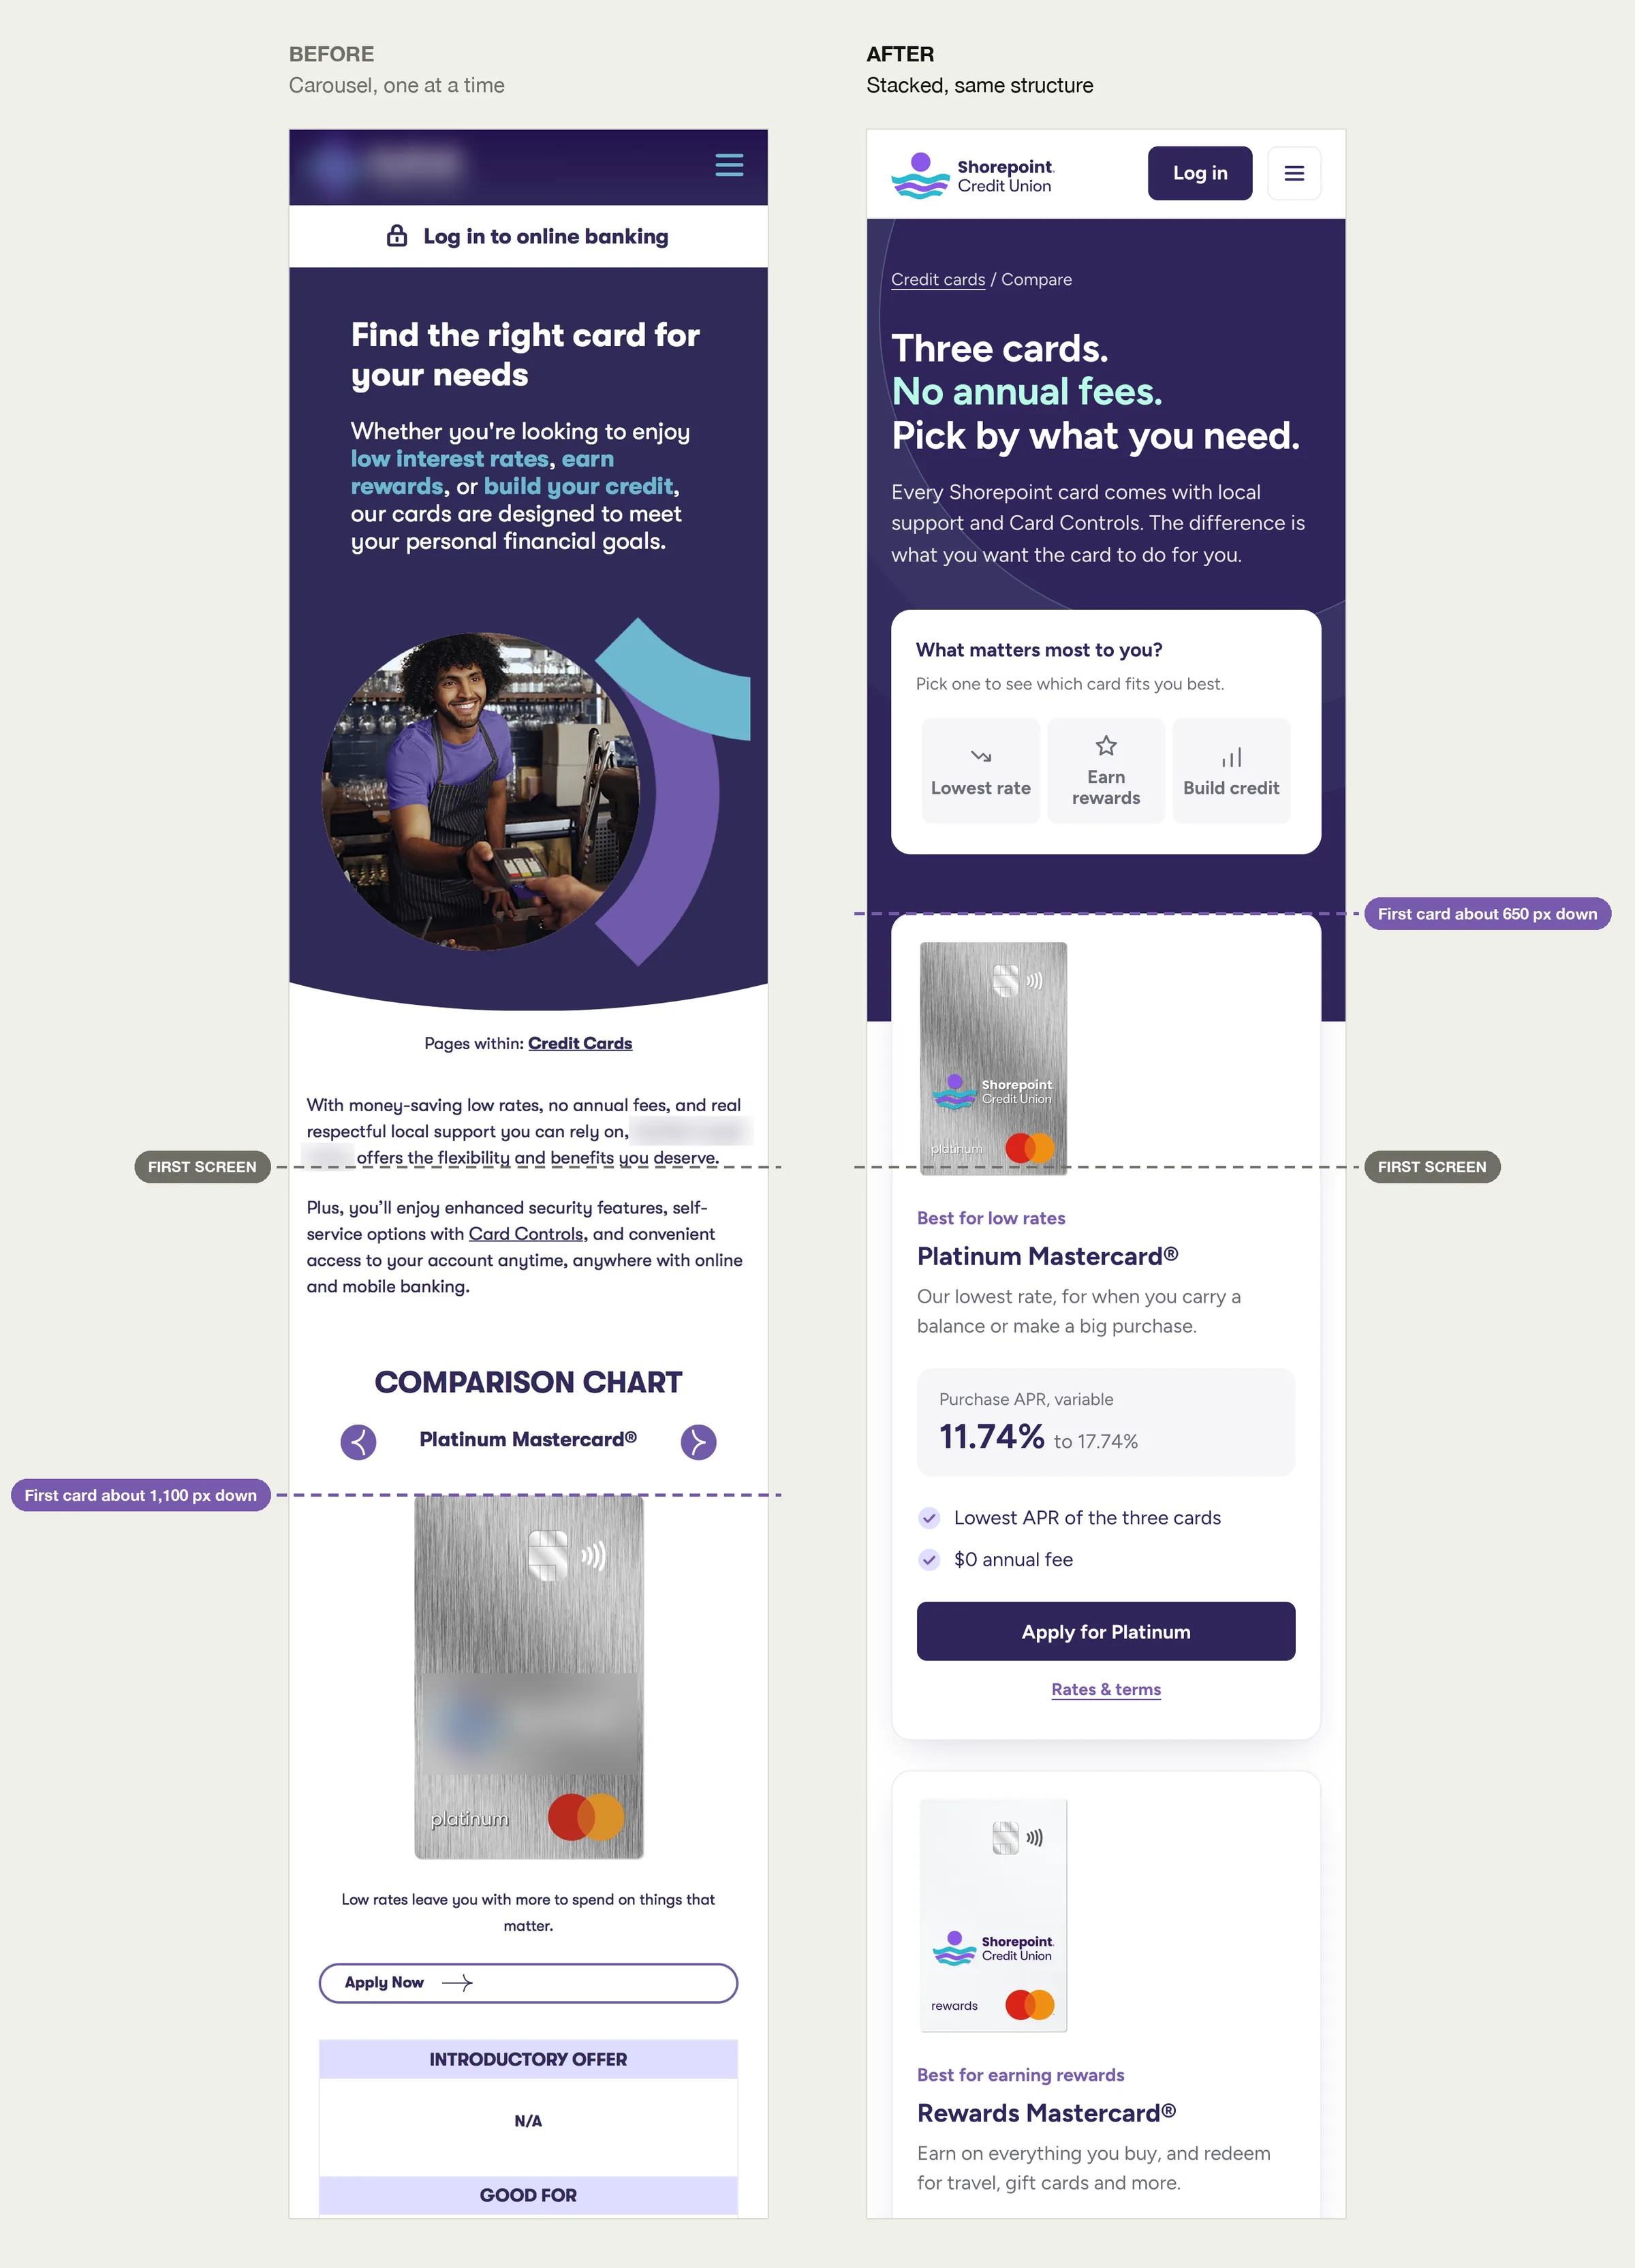
2One card at a time; first card about 1,100 px down
3Table says 1%. FAQ says no fee.
02
What I found
14
Issues in an audit of the live page, desktop and 390 px mobile
~1,100 px
Down to the first card on mobile, in a carousel with no position dots
Half
Of the comparison rows identical for every card
“I'm scared to get the wrong one.”
The strongest theme in real user quotes
03
Three problems, three fixes
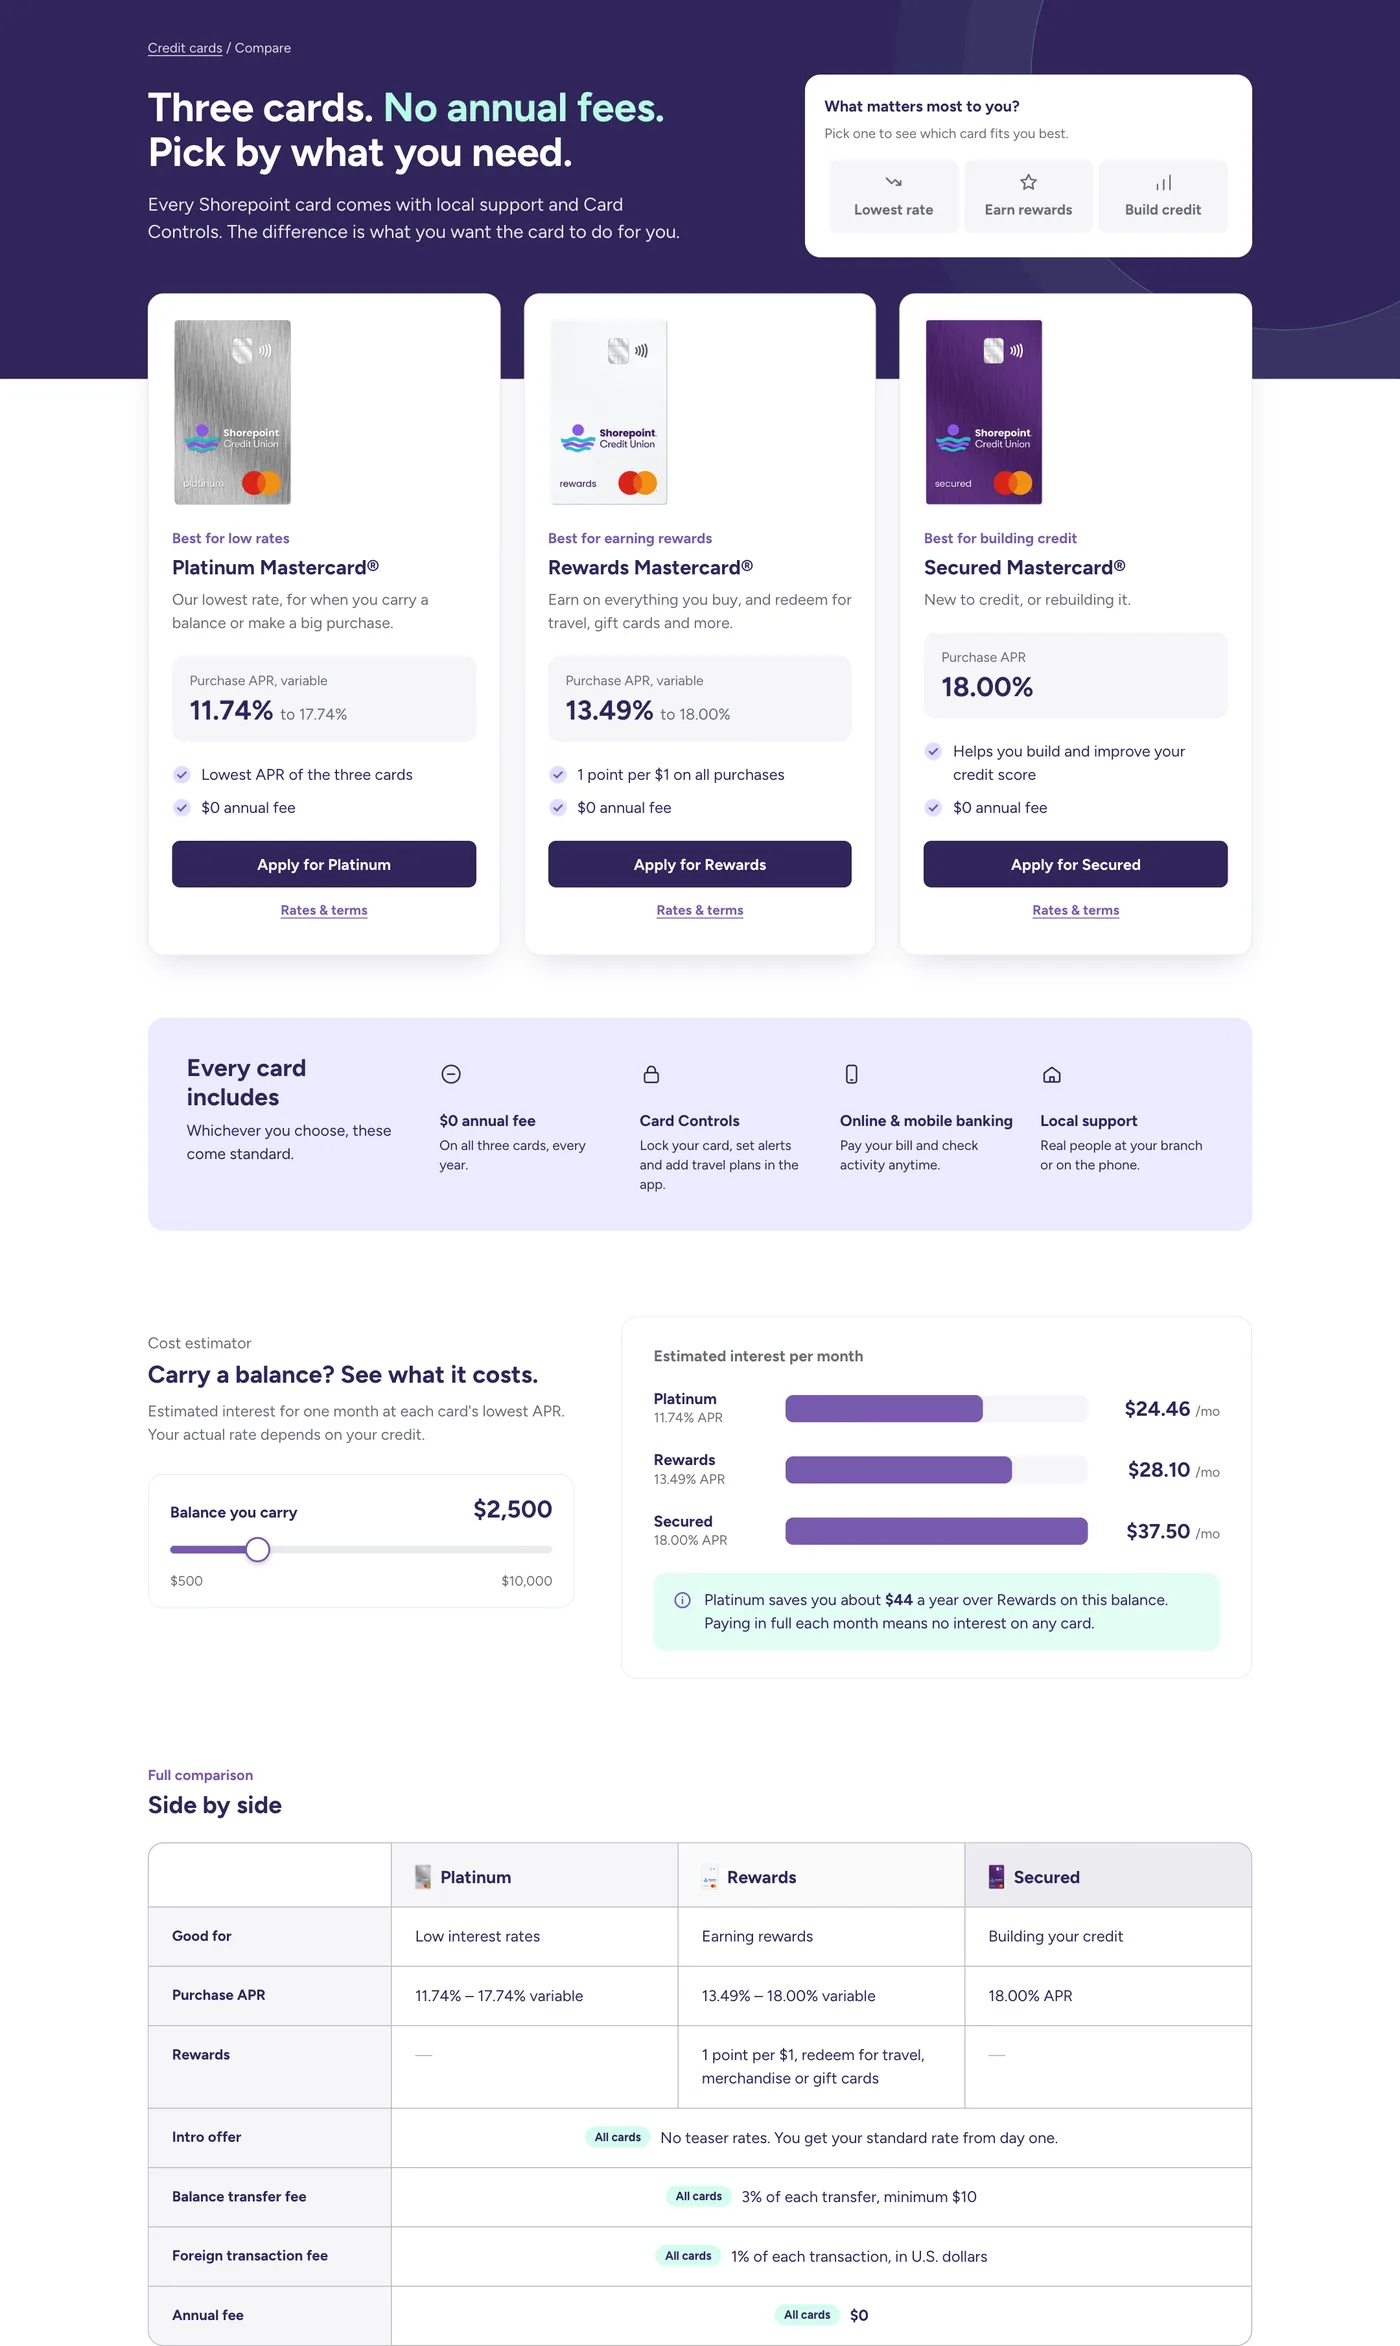
1Can't tell which card fits
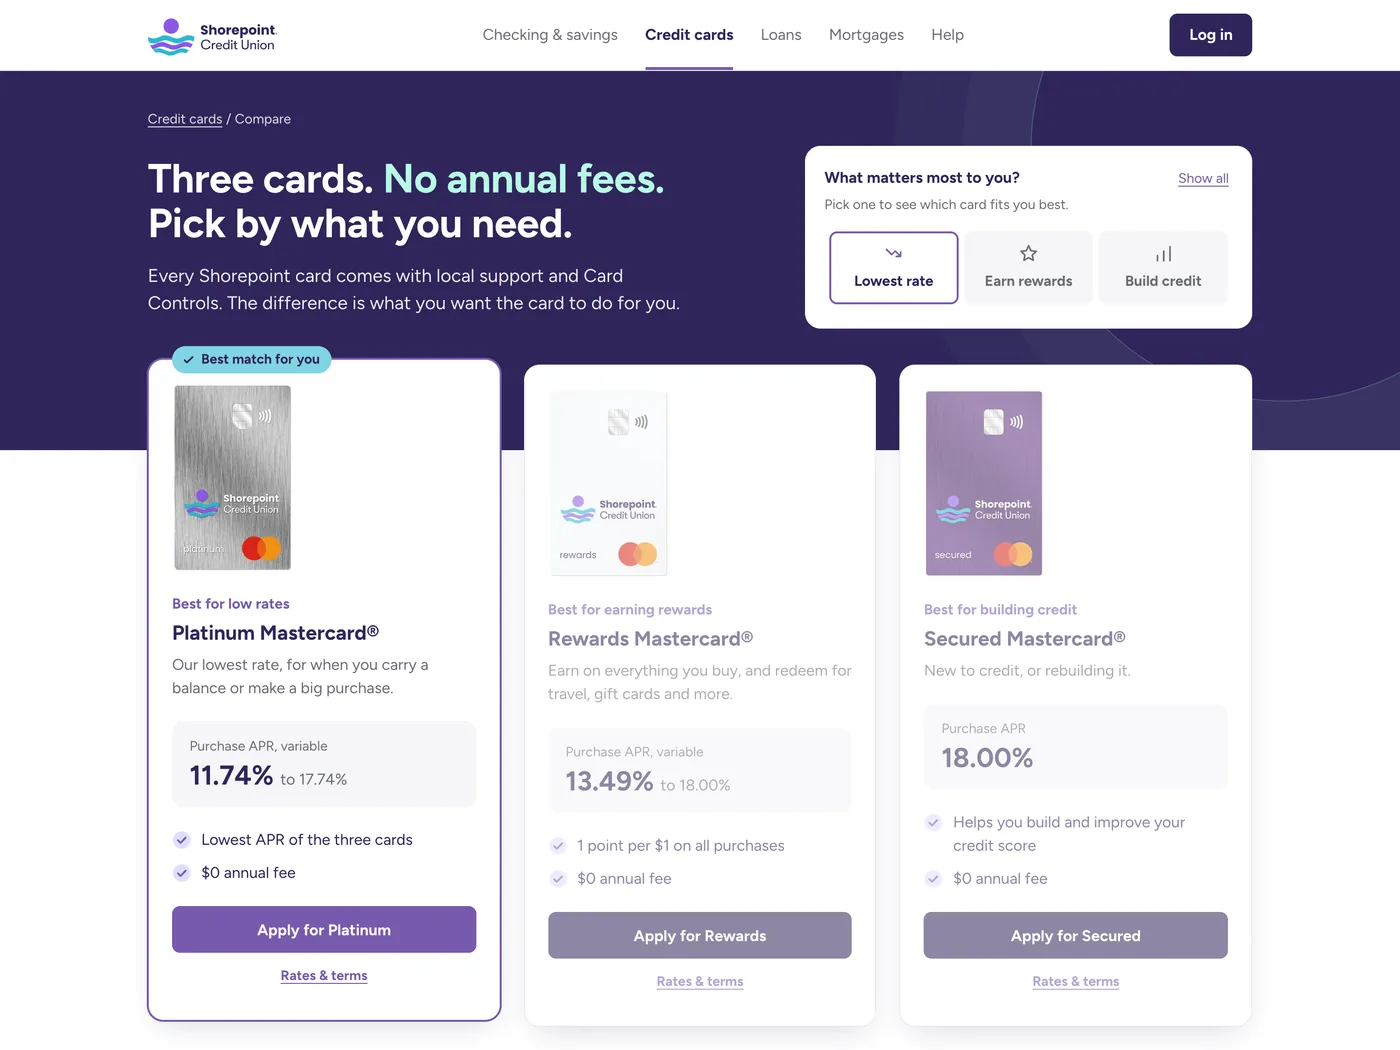
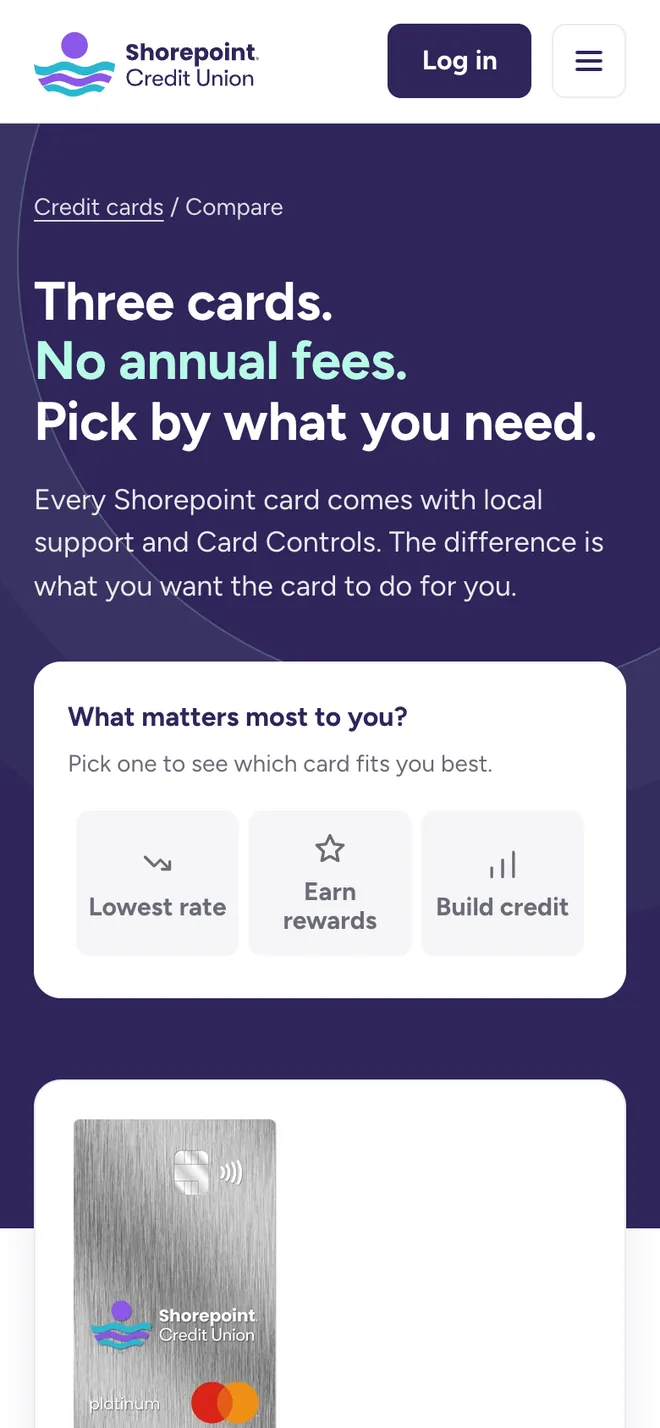
A one-tap “What matters most to you?” picker marks the best match, and every card leads with a “Best for” label
2Can't compare on a phone
Cards stack in one scroll with the same structure; the first card now starts about 650 px down
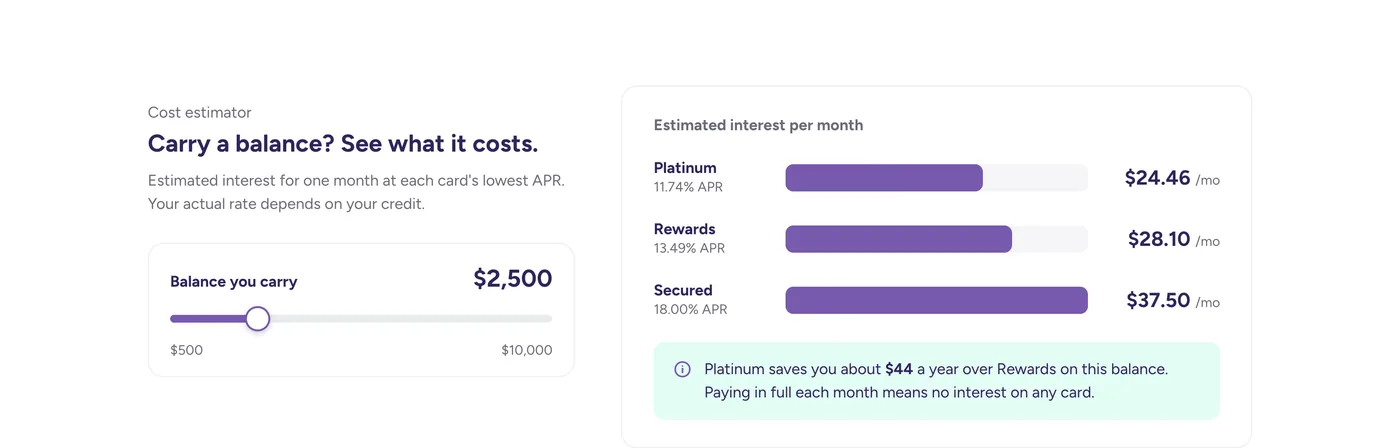
3Costs are confusing and contradict
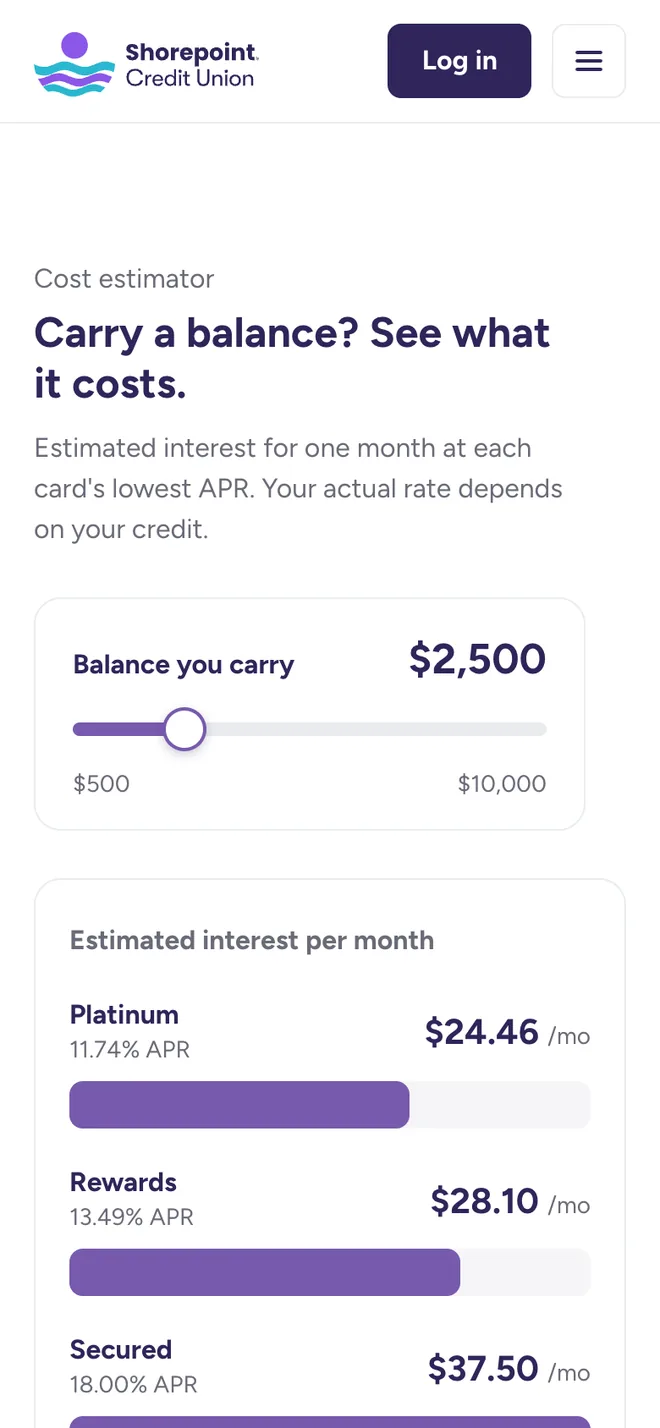
An estimator shows interest in dollars ($24.46 a month on $2,500), shared terms appear once, and every fee says the same thing everywhere
04
Before and after
Desktop
Before
After
Mobile
05
Interactions on mobile
Two moments that make the phone layout work: picking a goal jumps straight to the matching card, and dragging the balance shows the cost in dollars.
06
Built for a bank
APRs stay as variable ranges, estimates are labeled, and nothing promises approval.
07
Next
Test the original and the redesign with five people using the same task, then design prequalification, a membership note and rewards value in the estimator.
Takeaway
The biggest gains came from removing and reordering, not adding.
In banking, accuracy and plain language are design decisions.
Unsolicited concept based on a real credit union's public page. Name and details changed; not affiliated with or endorsed by that organization.
More work